

Since 2015, the AppsFlyer Performance Index has assisted mobile advertisers in making their most critical decisions, like which media sources to work with.
The first comprehensive index of the post-ATT era demonstrates how damaging Apple’s privacy measures have been to the mobile media industry. What truly sticks out are significant swings in the H2 2021 rankings — mostly in iOS (but also in Android), primarily in gaming (but also non-gaming), and primarily among SRNs (but also non-SRNs).
The media shakeup’ in 2022 implies one thing: thoroughly examining the Index is now more vital than ever! Apps Flyer’s second SKAN Index has also seen significant advances in terms of breadth and methodology. More data and more specific rankings include in-app interaction, in-app purchases, and in-app advertising signals.
The ranking of the Apps Flyer Performance Index has been done on three fronts:

Time Frame: H2 (2021) (July-December)
Volume: Based on client adoption and the number of credited instals on a per-platform, region, and category basis (where applicable).
Fraud: Based on a fraud rate threshold determined for each location and category (a detailed explanation appears in the fraud section). The market scale of AppsFlyer allows delivering the most realistic effect of fraud on the performance of media sources.
The SKAN Index:
AppsFlyer standardized and combined the number of installations ascribed to each media source based on SKAdNetwork postbacks, the number of applications running with each media source, and the weighted SKAN score.
SKAN Score:
AppsFlyer calculated the share of postbacks with a conversion value that indicates the post-install in-app activity of each app running with a specific media source for each app—extracting the median among these apps to determine the network’s SKAN score (the “translation” is based on AppsFlyer’s Conversion Studio SKAN conversion value mapping).

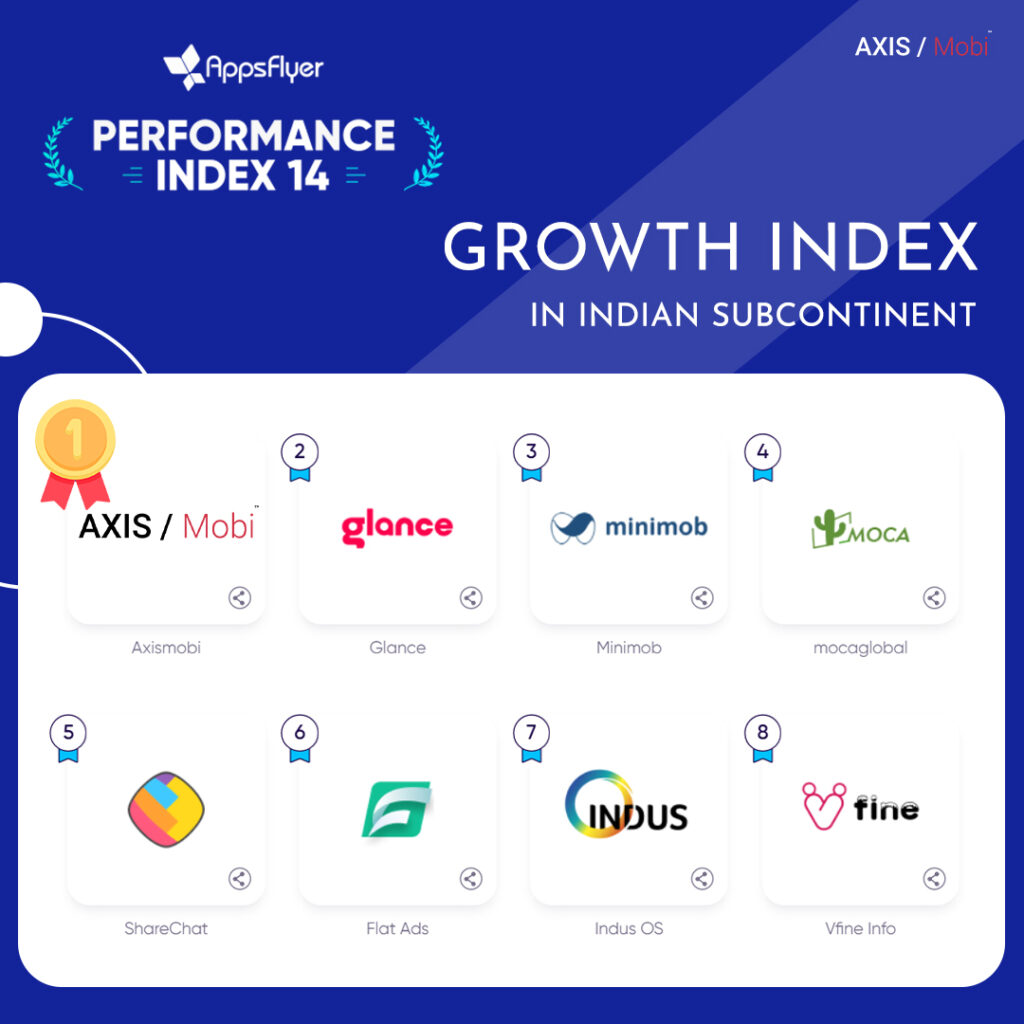
The Android Growth Index:
AppsFlyer compared the performance of the top 150 media sources in the second half of 2021 to the first half of 2021. The comparison was generated by integrating a variety of parameters on a worldwide or regional basis, including install growth, app number growth, and an increase in the proportion of the app install pie.
Axismobi topped all the parameters in the Indian Subcontinental region, outstanding all the giant companies like ShareChat and PhonePe.
We are a mobile marketing platform that is data-driven and performance-based. We link advertisers with high-performing audiences through direct response and brand campaigns powered by in-house data learnings on mobile advertising, providing a complete mobile marketing solution with a network of top tier mobile publishers and a full spectrum of distribution across all carriers, mobile devices, and tablets.

